30 day map challenge
Come back in November
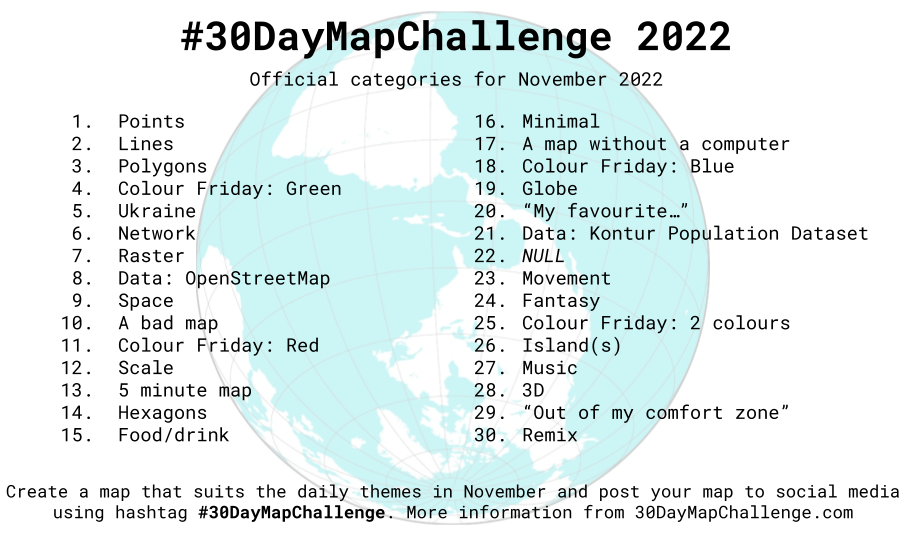
This year I will participate in the 30 day map challenge. The idea is to create maps based around different themes each day of November and share them using the hashtag #30DayMapChallenge. I will post maps here and on my twitter page. Stata do files will be avaliable on my github page. Come back in November to check out my maps!
Image source: https://30daymapchallenge.com
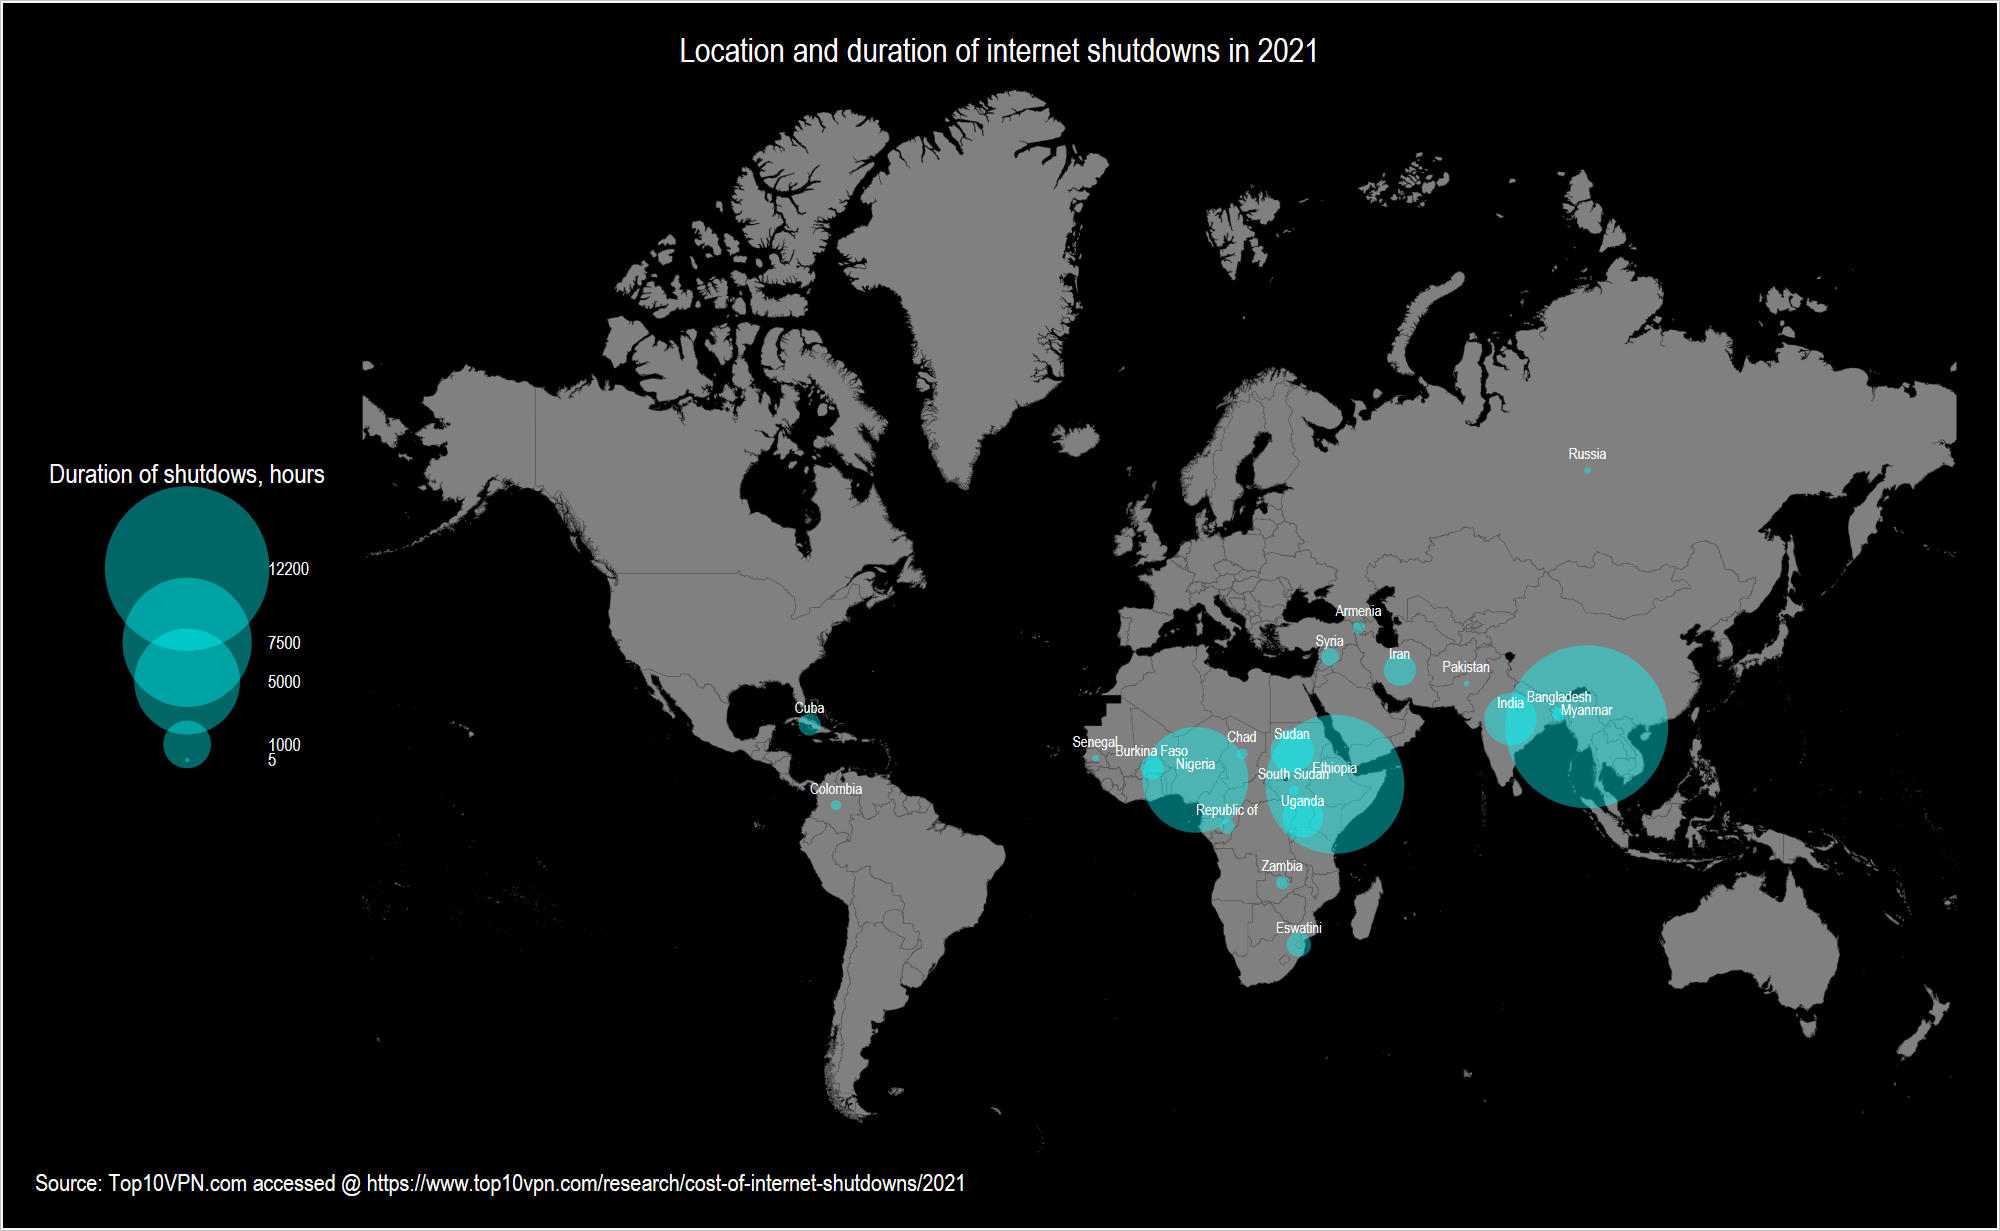
November 1: This point map graphs the location and duration (in hours) of internet shutdowns in 2021.
The duration data on the internet shutdown is from Top10VPN.com and can be accessed here.
World shapefiles are from the Word Bank. World Country Polygons - Very High Definition shapefiles can be accessed
here.
The Stata dataset and do file are available on my GitHub repository.
November 3: This polygon map shows the changes in internet penetration rates (% of individuals that use Internet) from 1990 to 2020.
The data are from the World Bank Development Indicators. Separate maps for each year are created in Stata, saved as png files,
and then combined into a gif image. The Stata dataset and do file are available
on my GitHub repository.
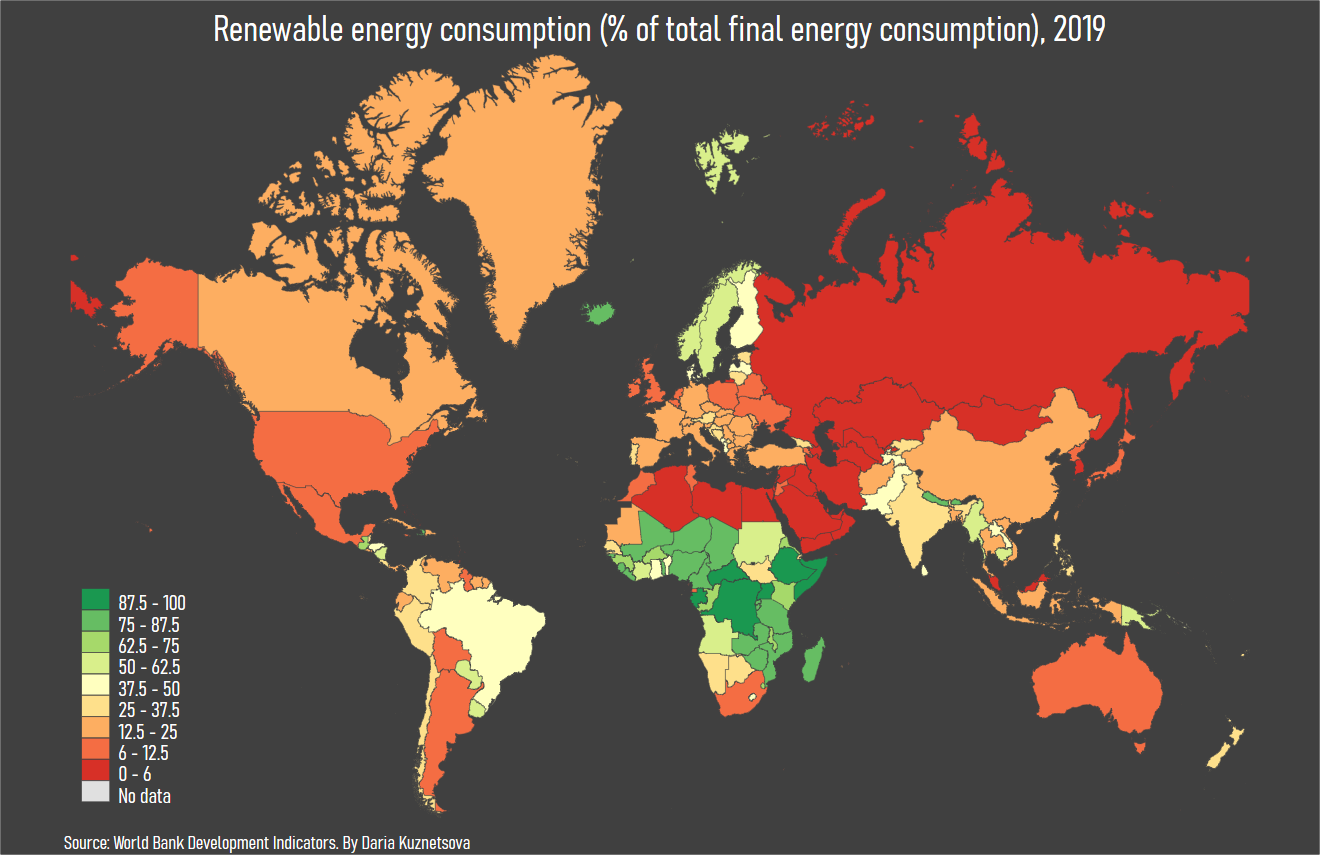
November 4: Color Friday: Green. This polygon map shows renewable energy consumption as a percentage of total final energy consumption in 2019.
The data are from the World Bank Development Indicators. The Stata dataset and do file are available
on my GitHub repository.